Strategic Arbitrage: Post-Earnings Drama Causes Dynatrace’s (DT) Call Spreads to be Favorably Mispriced
/Code%20on%20computer%20screen%20java%20html%20by%20Pexels%20via%20Pixabay.jpg)
While multinational technology company Dynatrace (DT) initially enjoyed a surge higher following its earnings results, DT stock eventually ended flat for the day. Fundamentally, it appears that investors were disappointed with the soft guidance for the full fiscal year. Nevertheless, an underappreciated quantitative signal suggests that aggressive traders may have a discounted opportunity on their hands.
On paper, everything seemed to be in place for a solid run for DT stock. On Wednesday, Dynatrace — which provides an observability platform covering application performance, software development and cybersecurity, among other services — posted adjusted earnings per share of 42 cents in the first quarter of fiscal 2026. This figure beat the consensus target of 38 cents.
On the top line, the tech giant generated sales of $477.3 million, which also exceeded Wall Street’s expectations. Previously, analysts had targeted revenue of $467.7 million.
In the morning session, DT stock saw two pronounced peaks during the midweek session. Unfortunately, in the afternoon hours, the security trimmed its earlier enthusiasm, ending the day at $50.53. During the afterhours session, DT gained modestly, around half-a-percent.
Looking at Dynatrace’s press release, it’s possible that investors took a dim view of the relatively soft guidance. For example, management guided up fiscal 2026 revenue by just $20 million, a change of about 1%. Further, annual recurring revenue (ARR) guidance moved up by $13 million. Sure, the earnings beat was great but without an accompanying strong boost in guidance, market participants may have read between the lines.
It's also possible that investors were seeking a greater improvement in non-GAAP operating margins. While this figure landed at 30% in fiscal Q1, it represented only a small lift from the year-ago quarter’s tally of 29%.
Still, even with the digestion of less-than-favorable line items, DT stock seems a compelling wager from a quantitative perspective.
Using an Empirical Framework to Find the Asymmetric Opportunity in DT Stock
Reading a competing platform’s “analysis” on Dynatrace, the article implied that because DT stock traded below its 50-day and 200-day moving averages, it represents a potential discount. However, I find that this is a presuppositional argument because it smuggles the conclusion (that DT will move higher) into the premise (that DT was previously trading at a correct level and that moving averages offer reliable benchmarks of “correctness”).
I’m not convinced by this type of “logic” because it’s circular. It’s a fancy way of saying that the stock is going to move higher because I think it’s going to move higher. Instead, I prefer to view the market as a voting sentiment record. The equities sector is bimodal in nature, with bulls and bears attempting to gain control. But at the end of the day, one side wins out.
I’m not interested in the wild ideological dance. I’m just interested to know what the market did.
For example, in the past 10 weeks, the market voted to buy DT stock six times and sell four times. Throughout this period, the security incurred a downward trajectory. For brevity, we can label this sequence as 6-4-D.
It’s an unusual signal because, even though accumulative sessions outweigh distributive, the trajectory was negative. Notably, this pattern only materialized 22 times on a rolling basis since Dynatrace’s initial public offering. However, having identified this signal, we can look to past analogs to see how the market responded to the 6-4-D. In addition, we can look at the demand profiles of major sequences for comparative purposes:
L10 Category | Sample Size | Up Probability | Baseline Probability | Median Return if Up |
3-7-D | 23 | 56.52% | 54.46% | 3.00% |
4-6-D | 45 | 44.44% | 54.46% | 2.36% |
4-6-U | 12 | 33.33% | 54.46% | 3.42% |
5-5-D | 34 | 55.88% | 54.46% | 3.97% |
5-5-U | 30 | 63.33% | 54.46% | 2.97% |
6-4-D | 22 | 63.64% | 54.46% | 5.40% |
6-4-U | 51 | 52.94% | 54.46% | 2.59% |
7-3-U | 38 | 50.00% | 54.46% | 5.30% |
8-2-U | 14 | 57.14% | 54.46% | 1.72% |
From the table above, we can see that the chance for a long position in DT stock to be profitable is 54.46%, a solid upward bias. This is effectively our null hypothesis, the probability of upside success assuming no mispricing. In contrast, our alternative hypothesis is that, due to the 6-4-D sequence, the probability of upside is 63.64%. Therefore, we have an incentive to consider a debit-based strategy thanks to the heavy bullish bias.
Assuming the positive pathway, the median return in the following week is 5.3%. It’s possible, then, that DT stock could hit about $53.21 quickly, perhaps in a week or two. Should the bulls maintain control of the market for a second week, the price per share could potentially reach $55.65.
Taking What the Market Will Give
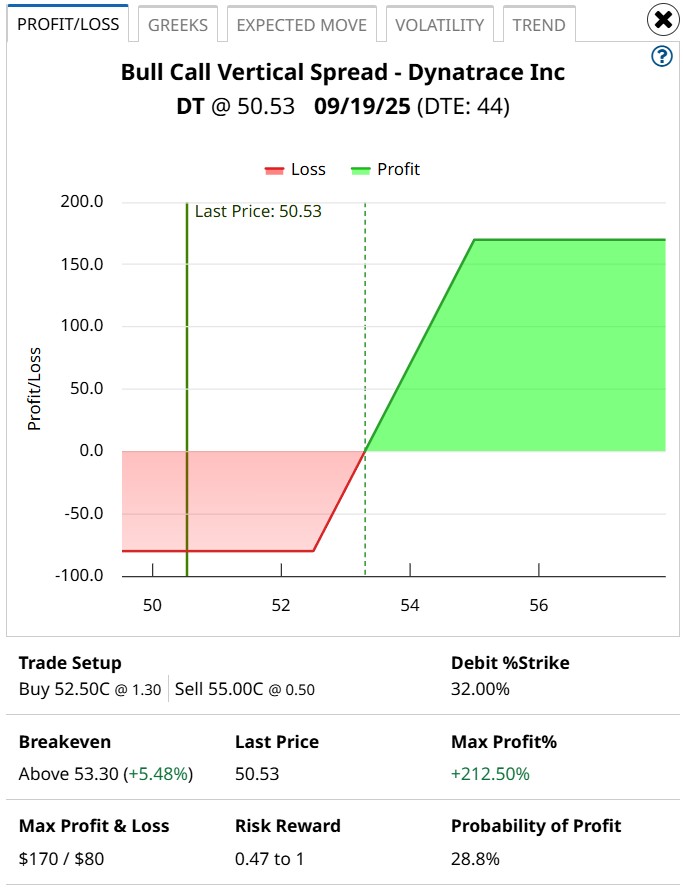
For me, one trade stood out as a practical no-brainer: the 52.50/55 bull call spread expiring Sep. 19. This transaction involves buying the $52.50 call and simultaneously selling the $55 call, for a net debit paid of $80 (the most that can be lost in the trade). Should DT stock rise through the short strike price ($55) at expiration, the maximum profit is $170, a payout of over 212%.
What makes this trade appealing is the historical trends based off the 6-4-D sequence: past analogs suggest that a share price north of $45 is very realistic. Therefore, a Sep. 19 expiration date allows for some time margin, just in case exogenous factors unexpectedly screw up the forecast.
Of course, much hinges on the statistical reliability of the 6-4-D sequence. Running a one-tailed binomial test reveals a p-value of 0.2542, which indicates that there’s a 25.42% chance that the implications of the signal could materialize randomly as opposed to intentionally. That’s quite high, which admittedly warrants pause.
However, what I think is causing the p-value to run higher than I would like is that the baseline probability is already quite generous at over 54%. With the alternative hypothesis providing a less than 10-percentage-point boost in positive delta, there is some risk of random noise affecting the trading setup.
Still, with the high payout, low net debit required and solidly positive baseline odds, I believe the risk-reward symmetry is attractive for speculators. It’s your call but this is a very intriguing idea.
On the date of publication, Josh Enomoto did not have (either directly or indirectly) positions in any of the securities mentioned in this article. All information and data in this article is solely for informational purposes. For more information please view the Barchart Disclosure Policy here.